One of the more common questions that I get from students is:
“What is the first step to building a financial model?”
The first step to building a financial model in Excel can be scary. You don’t want to spend time going down the wrong path and then realize you’ve made fundamental mistakes in the layout of your model. If you do, you’ll have to start back over with a clean page, and those hours will essentially be wasted.
So, where do you start? Cash flow? Sources and uses? Naming worksheets?
In my experience, the best thing to do is to not start your model in Excel. Instead, you start with a picture. Paper works well for this process, but personally, I prefer a whiteboard.
Basically, you start making boxes and drawing lines so you can figure out what data needs to flow from one worksheet into another. The goal is to define the inputs and outputs of each worksheet. Once you have clearly defined inputs and outputs for each worksheet, and it’s all mapped, then building the actual workbook is a pretty straightforward process. The other benefit of mapping everything is that if you truly know what inputs and outputs you need, you can break the process of building a model into parts, and different people can work on the parts at the same time. Then, the parts can be brought together into a coherent whole.
Of course, talking about a picture isn’t that useful.
See below for a simple example of a “wireframe” for a model.
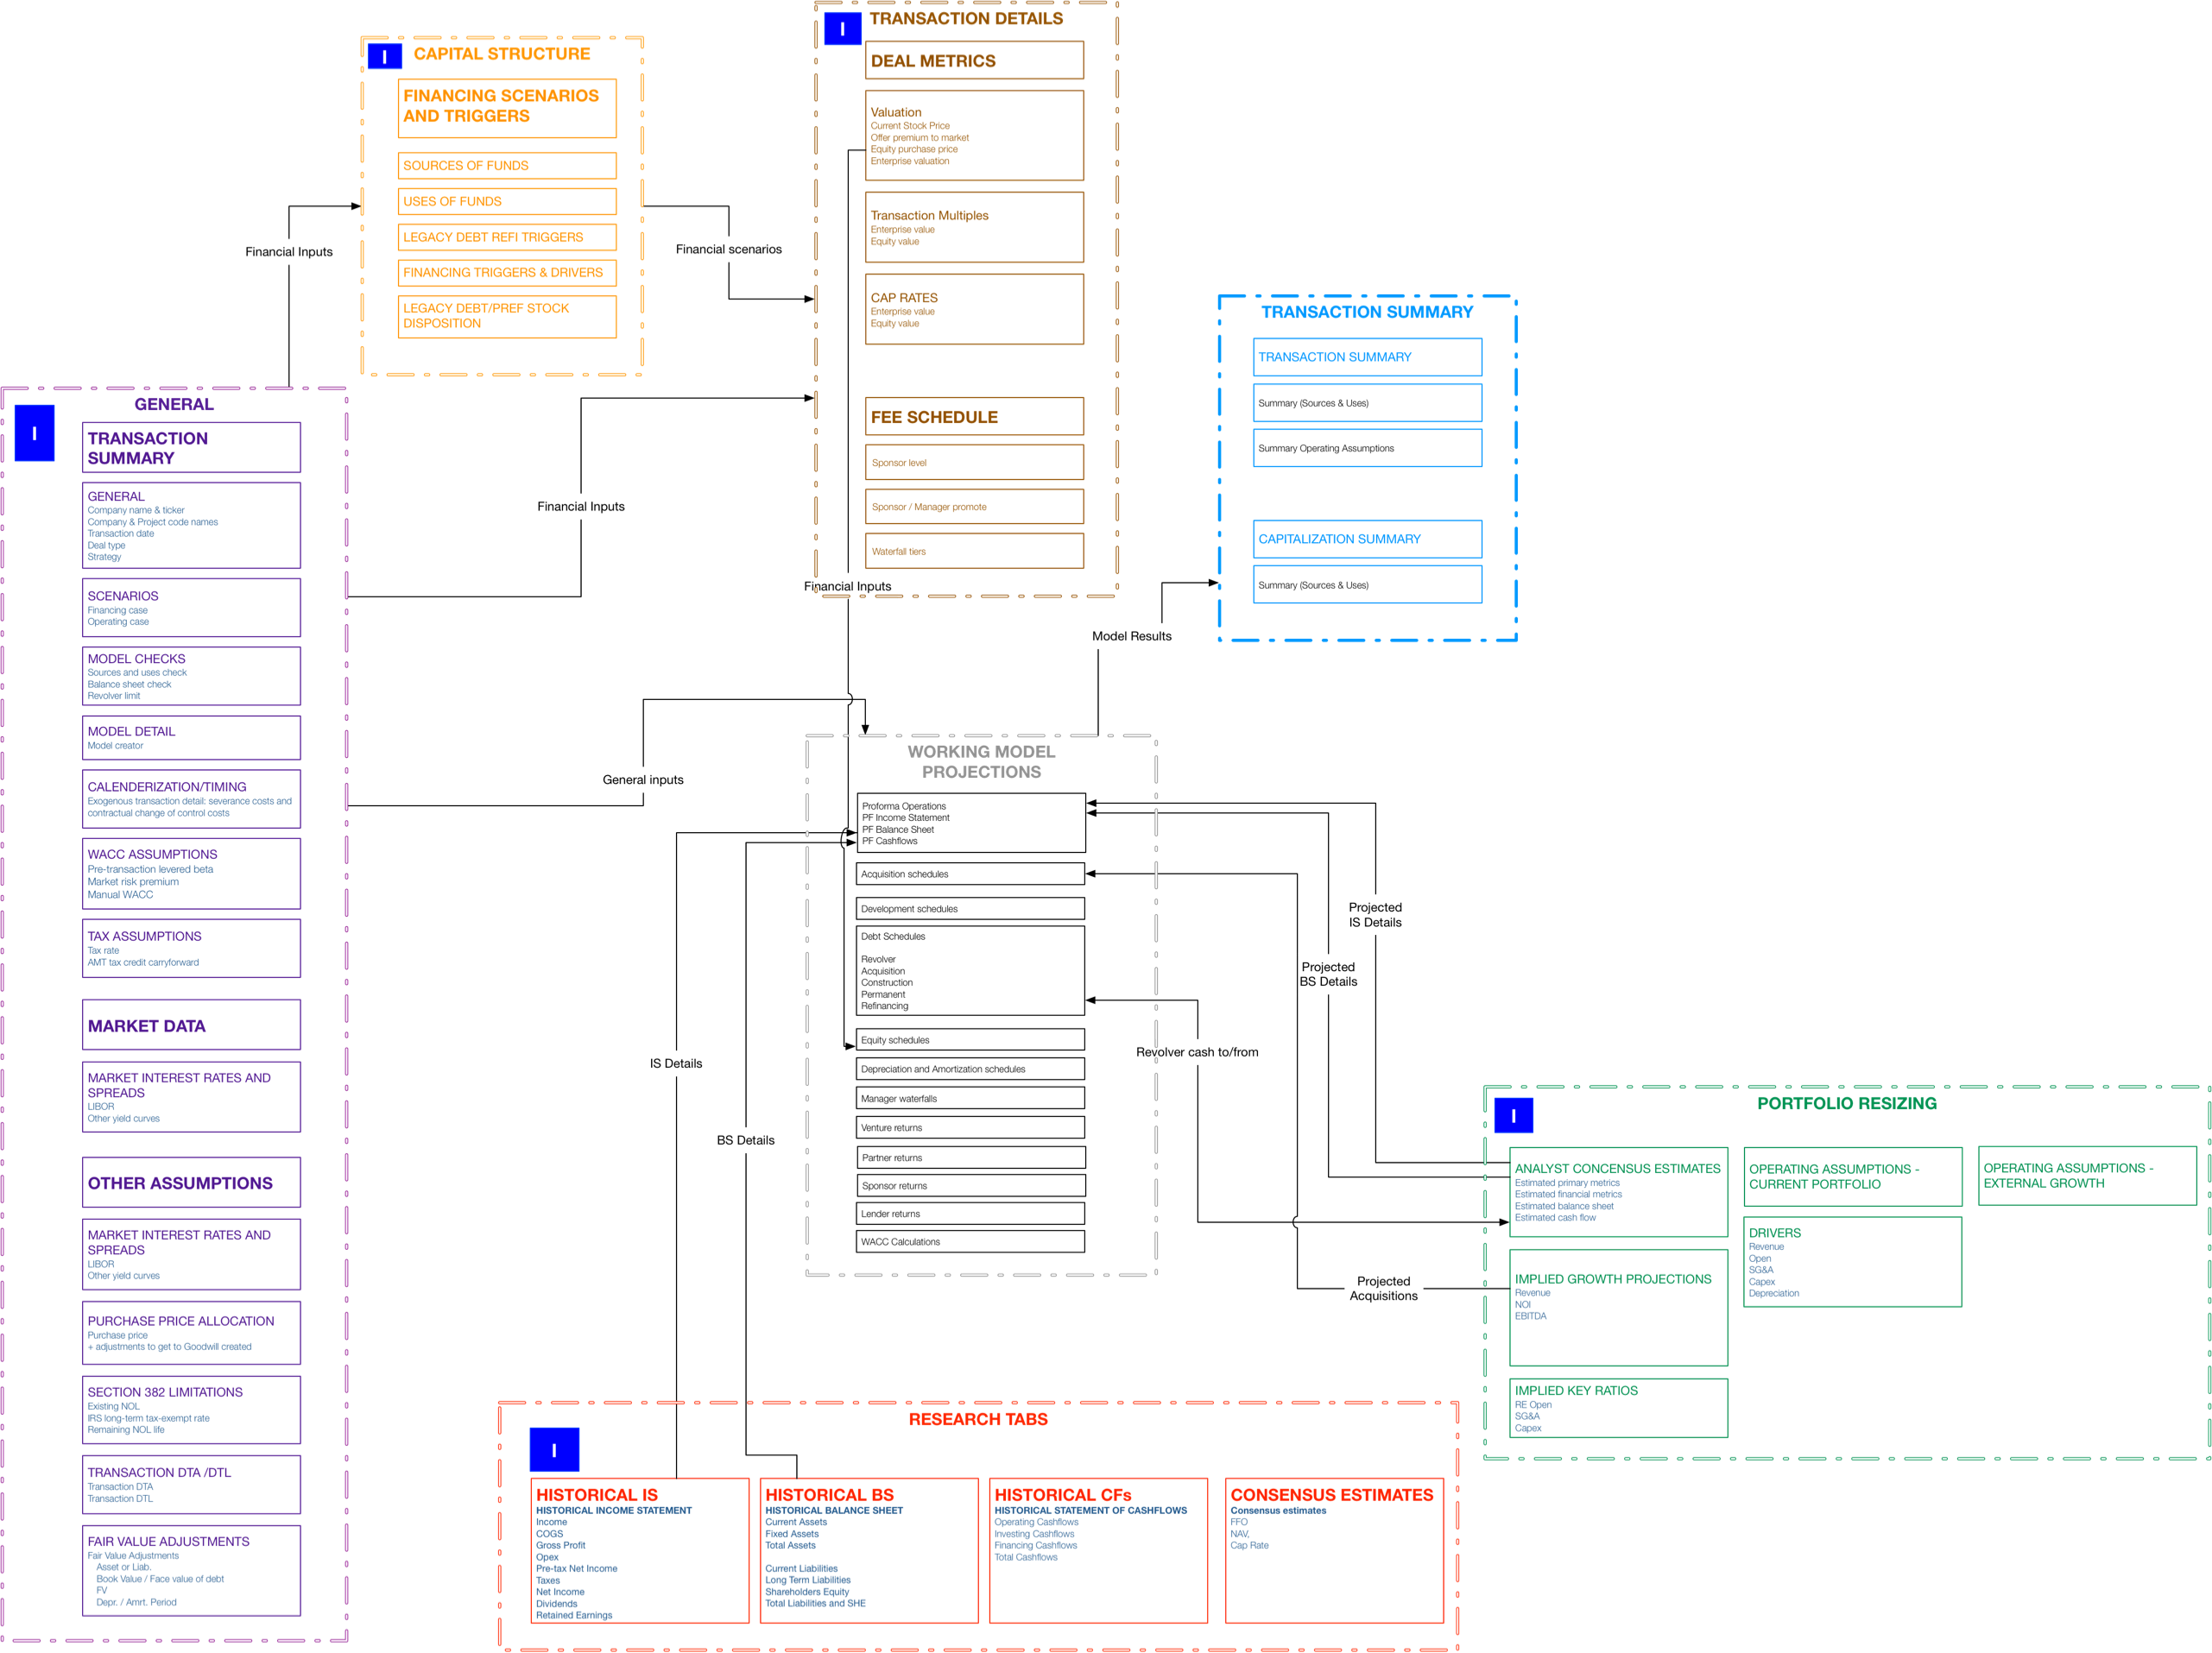
As the old saying goes, a picture is worth a thousand words (or 100 hours in Excel).
That’s the way we do it over here; once you do it this way once, you’ll never go back.